The Employee Net Promoter Score (ENPS) question is related to, but also different to, the more Familiar "Net Promoter® Score" questions that are most commonly used in customer experience and satsfaction surveys.
The key difference is in what they measure via who they're aimed at. NPS is focused on people outside your business. ENPS is used to gauge how those inside your business, your employees, feel about working for it, by asking how likely it is they would recommend that others work there.
In the same way as "traditional" NPS, the outcome is a score between -100 and 100. It does this by measuring the likelihood that the respondent is a detractor, or a promoter.
While allowing for more flexibility than Net Promoter® Score, ENPS questions still need to conform to the format of a question about how likely the respondent is to recommend their workplace as a place to work, answered on a 0-10 scale. If you wish to create a more flexible scale then please consider the Matrix of Choices, One Answer per Row question type instead.
Creating Employee Net Promoter Score Questions
To create your ENPS question:
- Click Add Question on your survey.
- From the menu, select Employee Net Promoter Score.
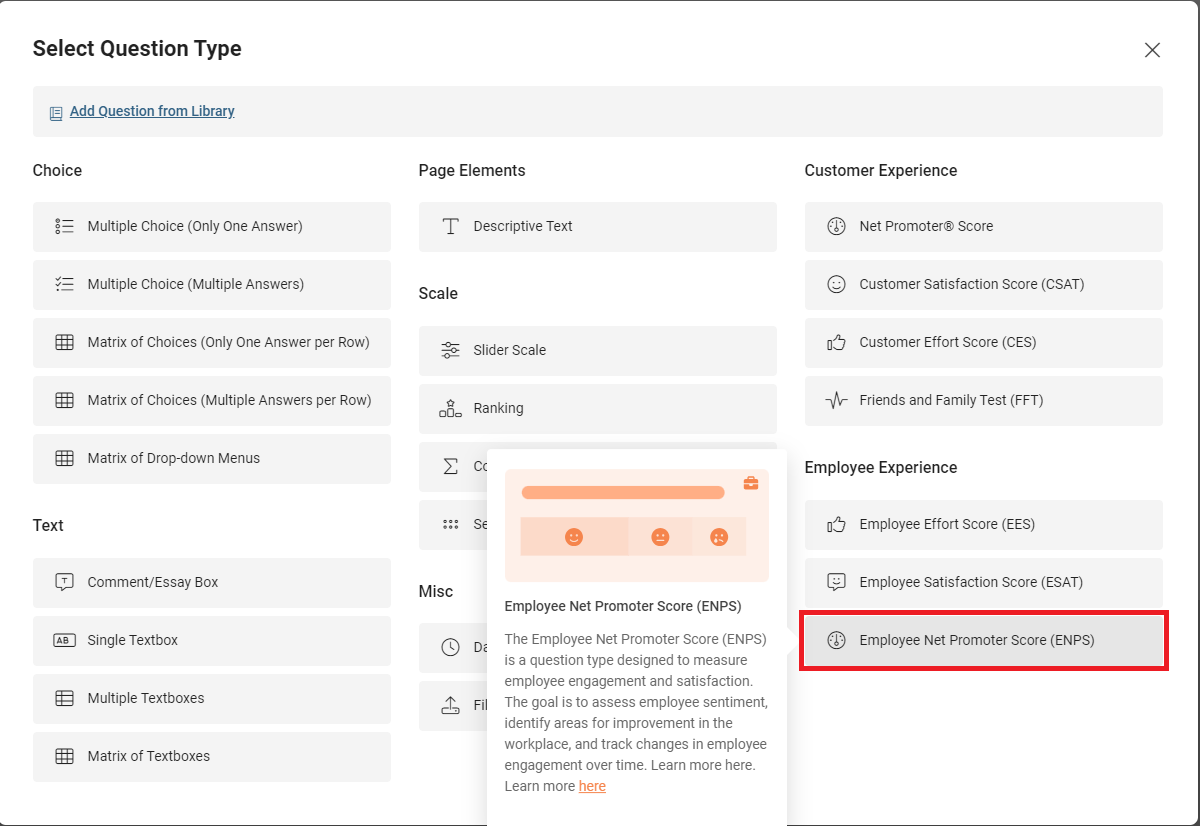
- In the Question field, customise your question.
- Click the green Save Question button to add the question to your survey.
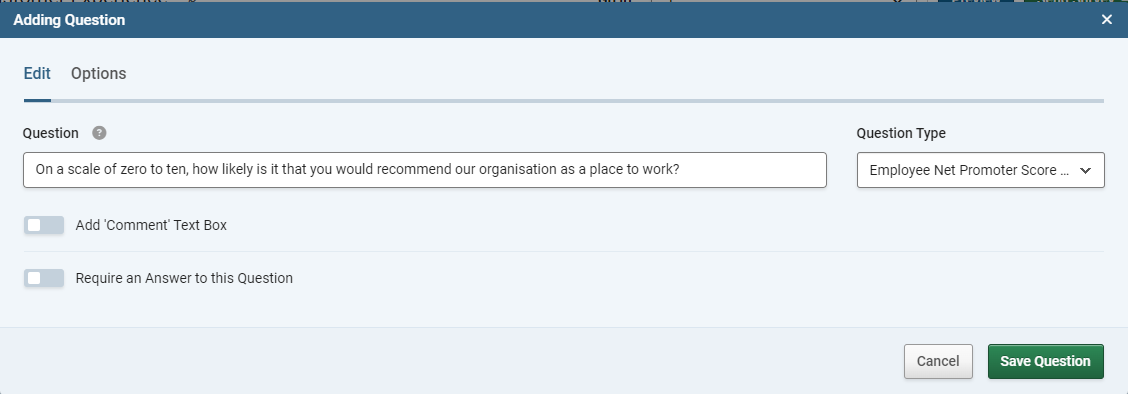
Customising Employee Net Promoter Score Questions
When you build a NetPromoter Score question, you can customise it with the following additional fields and options:
| Add "Comment" Text Box |
Adds a free text field underneath the question. |
| Require an Answer to this Question |
Forces the respondent to select an answer before they can progress to the next page. |
Reporting on Employee Net Promoter Score Questions
Employee Net Promoter Score questions get access to two additional display options, the Gauge Chart and the Trend Chart.
Gauge Chart
The Gauge Chart displays the current ENPS for the survey (after applying any chosen filters) on a gauge scale with a pointer, with -100 being the low limit, +100 being the high limit, and 0 in the centre.
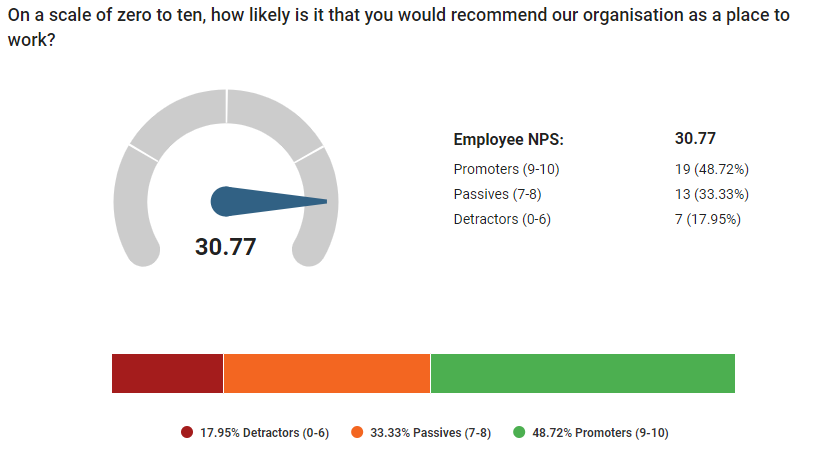
The ENPS Gauge chart visual has some exclusive options:
| Gauge |
Set whether or not the Gauge visual is included. |
| Stacked Bar |
Toggle the bar showing the visual breakdown into promoters, passives, and detractors on and off. |
| Statistics Table |
Toggle the table of numerical data (to the right of the gauge) on and off. |
Trend Chart
The Trend Chart shows the calculated Employee Net Promoter Score over time. It does this by dividing the responses into groups based on a time window (Day, Week, Month, Quarter, Year) and then calculating the ENPS for each group. this is then displayed on the chart.
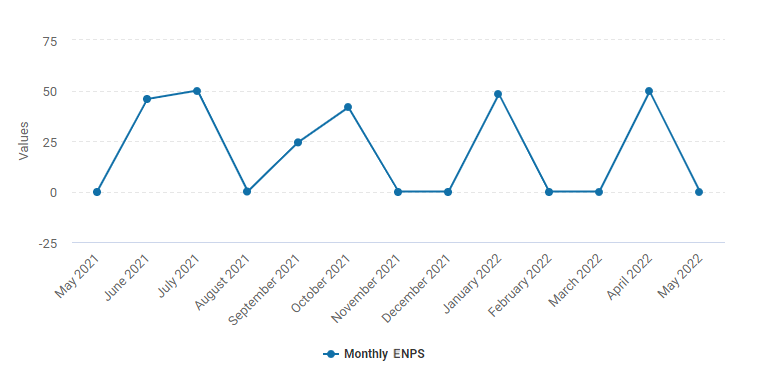
Trend Chart Options:
| Trend By |
Set the period that each point on the chart will represent. |
ENPS Questions and Other Chart Types
ENPS questions can also be set to the Column, Bar, or Pie chart types. When put into these modes, the data presented will be the breakdown into the "Detractors", "Passives", and "Promoters" groups as defined by the Net Promoter standard.
Information for all other options, and for the "Display Options" tab, can be found in the guide "Creating charts from Survey Results"