Using SmartSurvey for a Friends and Family Test.
Friends and Family Tests are feedback surveys used throughout the UK National Health Service (NHS).
SmartSurvey users with the appropriate plan features can access a specific question type which has been designed to comply with the official NHS guidance for doing Friends and Family Tests.
To start, log in to your account, and from the dashboard, create a new survey by clicking on the “Create New Survey” button.
Adding the Friends and Family Test (FFT) Question
To add the FFT Question, click on “Add Question” and in the pop-up, choose “Friends and Family Test (FFT)”.
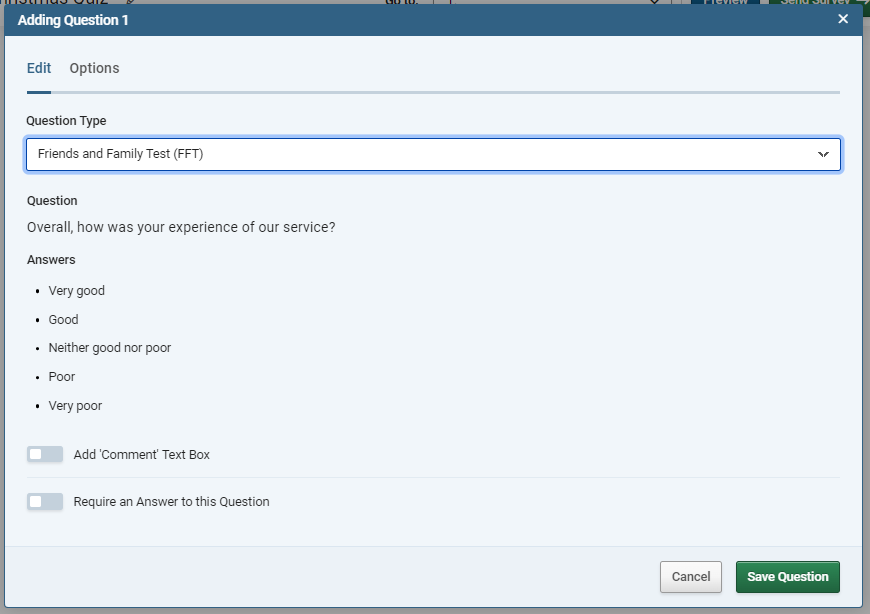
Because the format of the FFT question is fixed, neither the question text or answer options can be edited. You can choose to add a comment field, and you can choose to make the question mandatory.
Adding Preceding Text
If your organisation offers more than one service, you may want to add some text before the question to clarify what the survey is asking about. To do this, add a Descriptive Text question to your survey before the FFT question. This descriptive text should read:
“Thinking about”
And then continuing this line with one of the following:
- your GP practice…
- your stay in the hospital…
- your dental practice…
- your recent visit to A&E…
- this maternity service…
- our antenatal service…
- our labour ward…
- our birthing unit…
- our homebirth service…
- our postnatal ward…
- our postnatal community service…
- your recent appointment…
- your recent visit…
- our recent visit…
- the service we provide…
Or something in the same format, stating the service or interaction your service is about in simple terms.
Adding the Free Text Question
The final part of the FFT that is required is to add a free text question. To do this, add a "Comment / Essay Box" question to your survey, after the FFT question.
The current guidance recommends choosing one of the following as the question text:
- Please can you tell us why you gave your answer?
- Please tell us about anything that we could have done better
This is a recommendation, not a requirement and other questions may be used as best suits your organisation.
Reporting on FFTs
The FFT question type has access to a new chart type in the Summary Report, the Statisical Process Control (SPC) Chart.
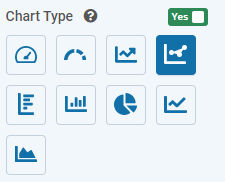
To set up an SPC Chart, find your question in the summary report for the survey and click "Customise" to set up the chart. Choose the SPC Chart by selecting the icon selected in the image below:
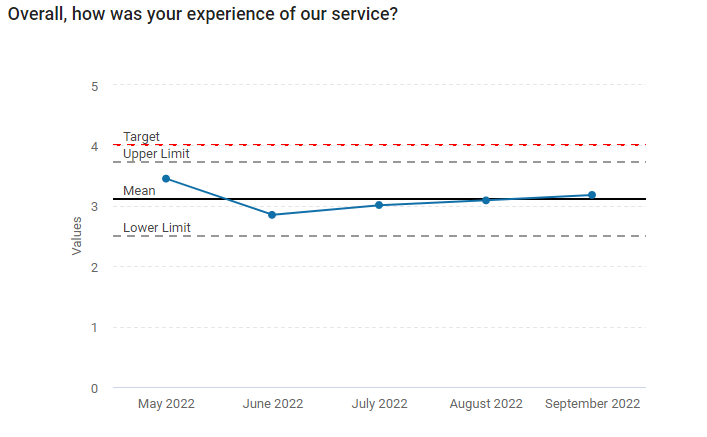
This is based on the existing trend charts, but allows the addition of benchmarking lines to show the mean and upper and lower limits of a bracket or interval around the mean. A target line can also be set manually. Reviewing how the trend line interacts with these benchmark lines can aid in the interpretation of survey data.
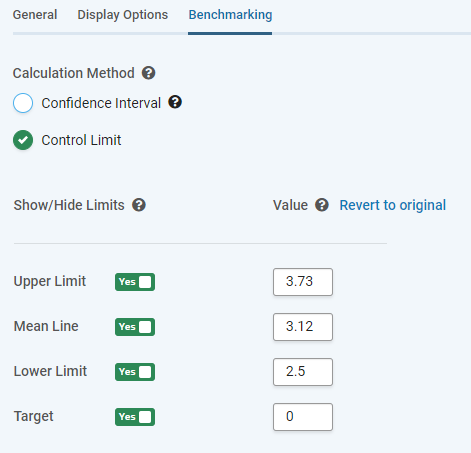
To set the options for the Benchmark lines on the chart, select the Benchmarking tab.
| Option |
Effect |
| Confidence Interval / Control Limit buttons. |
Selects the calculation used to draw the Upper and Lower Limits. |
| Percentage Drop-Down (Confidence Interval Only) |
Set the size of the Confidence Interval. Lower values will lead to "tighter" intervals. |
| Show/Hide Toggles |
Select Whether a benchmark line (Upper limit, Mean, Lower Limit, or Target) is shown. |
| Value Boxes |
Show the calculated values for the Mean and the Limits. These can be manually over-ridden by entering numbers in the box. Target is not a calculated value, so must be entered manually if desired. |
More details on the calculations behind these measures can be seen in the guide Trend Chart Benchmarking Calculations.